AWS Cost Explorer Pricing and What the API and Hourly Data Really Cost
By the CostAnalyst team
projected this month if unattended
Spend by team
Budget forecast
AWS Cost Explorer is free in the console. You can view 13 months of cost and usage history, 12 months of forecast, up to 38 months of monthly history and 14 days of resource-level daily data without paying anything. Two things cost money: the Cost Explorer API at $0.01 per paginated request, and hourly granularity at $0.00000033 per usage record per day, which AWS translates to about $0.01 per 1,000 usage records a month.
That sounds like rounding error, and for one engineer clicking around the console it is. The bill grows when Cost Explorer stops being a console and becomes a data source: a Grafana panel that refreshes every few minutes, a Lambda that posts a daily Slack summary per team, or hourly data switched on across an organization with tens of thousands of resources. Below is every charge AWS lists, what each one costs at realistic sizes, and the point at which paying for a cost tool is cheaper than paying for the API.
How much does AWS Cost Explorer cost?
The console costs nothing, and most of the data settings that sound premium are free too. AWS made multi-year history and resource-level daily data free in late 2023. The charges that can show up on your bill are these.
| What you use | Price | Notes |
|---|---|---|
| Cost Explorer console, reports, forecasts | Free | 13 months of history and 12 months of forecast by default |
| Multi-year data at monthly granularity | Free | Up to 38 months, enabled from the management account |
| Resource-level data at daily granularity | Free | Past 14 days, for the services you pick |
| Hourly granularity (all services or EC2 resource level) | $0.00000033 per usage record per day | About $0.01 per 1,000 usage records a month, billed daily on the past 14 days of records |
| Cost Explorer API, primary billing view | $0.01 per paginated request | Every page of a response is a separate request |
| Cost Explorer API, custom billing view | $0.01 per source per request | A view combining 5 sources costs $0.05 per request |
| Rightsizing and Savings Plans recommendations in the console | Free | API calls for them are billed like any other Cost Explorer request |
Two neighbors are often confused with Cost Explorer on the bill. AWS Budgets is free for monitoring, with the first two action-enabled budgets free and $0.10 a day for each one after that, plus $0.01 for each budget report delivered by email. Cost Anomaly Detection has no charge. If your "Cost Explorer" line is larger than you expected, it is almost always the API or hourly data, not the console.
Is AWS Cost Explorer free?
Yes, for anyone who reads it in the browser. Every AWS account can open Cost Explorer, filter by service, account, region, tag or cost category, group by any of them, and see forecasts at no charge. It stops being free the moment a script reads it, because each API call is billed, or when someone enables hourly granularity in Cost Management preferences. Only the management account can change those preferences, and changes take up to 48 hours to apply and then lock for another 48.
What the Cost Explorer API costs at real call volumes
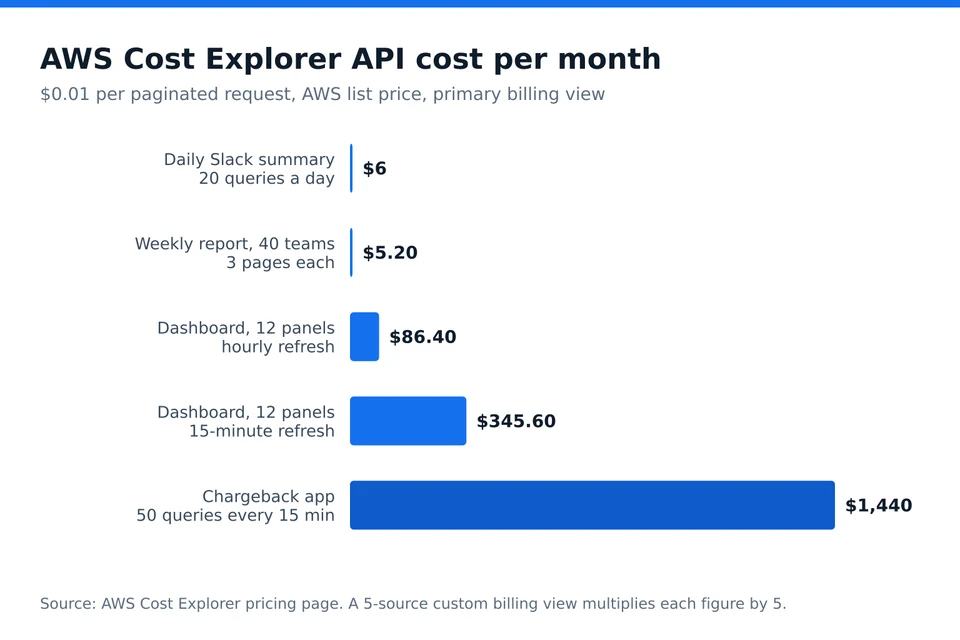
One cent per request is cheap until you count the requests. A dashboard does not make one call per refresh. It makes one per panel, and a grouped query that returns more rows than one page holds makes one per page. Here is what common setups cost per month at the list price.
| Setup | Requests a month | Monthly cost |
|---|---|---|
| Daily Slack summary, 20 queries per run | 600 | $6 |
| Weekly per-team report, 40 teams, 3 pages each | 520 | $5.20 |
| Grafana dashboard, 12 panels, refresh every hour | 8,640 | $86.40 |
| Grafana dashboard, 12 panels, refresh every 15 minutes | 34,560 | $345.60 |
| Internal chargeback app, 50 queries every 15 minutes | 144,000 | $1,440 |
| Same app on a 5-source custom billing view | 144,000 | $7,200 |
The last two rows are the ones that start budget conversations. Nobody designs a $1,440 a month dashboard on purpose. It happens because a refresh interval was copied from an infrastructure dashboard, where queries are free, onto a cost dashboard, where they are not. Cost data only changes a few times a day anyway, since AWS refreshes billing data at least once every 24 hours, so a 15-minute refresh buys nothing.
The cheap fixes are to cache responses for 6 to 24 hours, request monthly or daily granularity unless you need hourly, and collapse several panels into one grouped query. The structural fix is to stop using the API for reporting and read the Cost and Usage Report instead.
What hourly granularity costs
Hourly data is billed on usage records, and a usage record is one line item: a specific resource and usage type in a specific hour. AWS hosts the last 14 days of hourly records and charges $0.00000033 per record per day for everything hosted. AWS's own example is a single EC2 instance running all month: 336 records hosted (24 hours times 14 days), $0.0001 a day, about $0.003 a month.
The catch is that one resource is rarely one line item. An EC2 instance can produce separate records for compute hours, EBS volume usage, snapshots and data transfer. Using the AWS formula, each line item that runs all day costs about $0.0033 a month.
| Line items running every hour | Records hosted (14 days) | Monthly cost |
|---|---|---|
| 1,000 | 336,000 | About $3.30 |
| 7,500 | 2.52 million | About $25 |
| 30,000 | 10.1 million | About $100 |
| 150,000 | 50.4 million | About $500 |
A mid-size AWS estate with a few thousand resources lands around $25 a month, which is exactly the figure that confuses people on AWS forums when it appears without anyone remembering who switched hourly data on. At large Kubernetes or serverless scale, where short-lived resources multiply line items, it reaches hundreds of dollars a month. Note also that AWS refuses to save preferences whose estimated data volume exceeds its Cost Explorer threshold limit, so very large organizations cannot enable everything at hourly granularity at all.
Do you need it? Hourly data answers one question well: what happened during a specific spike, hour by hour, in the last two weeks. That matters for Savings Plans sizing, where commitments are hourly, and for incident reviews. For monthly chargeback, budgets and forecasting, daily resource-level data is enough, and it is free.
Cost Explorer vs the Cost and Usage Report for reporting
Teams that outgrow the API move to the Cost and Usage Report, now delivered through AWS Data Exports as CUR 2.0. The export itself is free; you pay S3 storage for the files and query costs if you analyze them in Athena, which charges $5 per terabyte scanned in US East. For most accounts a month of Parquet CUR is well under a gigabyte, so a query costs fractions of a cent. You get every line item at hourly or resource level with no 14-day window, and no per-request charge however often you read it.
| Approach | What you pay | Who it suits |
|---|---|---|
| Cost Explorer console only | $0 | One account owner checking spend weekly |
| Cost Explorer API behind a dashboard | $5 to $1,500+ a month depending on refresh and pages | Small scripts with cached results |
| CUR 2.0 plus Athena plus your own dashboards | A few dollars of S3 and Athena, plus the engineering time to build and maintain it | Teams with a data engineer to spare |
| A cost management tool that reads your billing export | A subscription, from $59 a month for CostAnalyst | Finance and engineering leads who need allocation, alerts and SaaS spend without building it |
If you already land billing data in a warehouse with other company data, a data integration platform that schedules the pipeline is usually cheaper than hand-written Lambda pollers hitting the API. The trap in the do-it-yourself path is not the AWS bill. It is that the dashboard becomes one engineer's side project, and nobody owns allocation rules, tag cleanup or the alert that should have fired when a test cluster was left running.
When paying for a cost tool beats paying for the API
Cost Explorer's limits are less about price than about scope. It covers AWS only, it allocates by tags and cost categories you maintain by hand, it has no view of SaaS subscriptions, and the free anomaly detection sends an alert without telling finance which team owns the spike. We cover those gaps in detail in AWS Cost Explorer limitations.
Three signals say it is time to buy rather than build. First, API spend over roughly $50 a month, because that money already pays for a tool that does more. Second, a monthly allocation spreadsheet that someone rebuilds by hand from Cost Explorer exports. Third, spend in more than one place, whether that is Azure, Google Cloud, Snowflake, Datadog or a SaaS stack nobody has inventoried.
CostAnalyst reads the AWS billing exports you upload, plus the SaaS subscriptions you list, and turns them into allocation by team, waste findings in dollars, anomaly alerts and a weekly digest for finance. It never needs API access to your account, so there is no per-request meter and no IAM review. Plans are $59, $179 and $479 a month, shown in full on the pricing page. If you are comparing other paid options, our guide to AWS cloud cost management tools prices them side by side, and AWS Cost Explorer alternatives covers who replaces the console entirely.
Frequently asked questions
Why am I being charged for AWS Cost Explorer?
Because something is calling the Cost Explorer API or hourly granularity is enabled. The console itself is free. Check Cost Explorer for the AWS Cost Explorer service grouped by usage type: API request charges and hourly usage records appear as separate usage types. Then check CloudTrail for ce: API calls to find which role, script or third-party integration is making them.
How much does the AWS Cost Explorer API cost per request?
$0.01 for each paginated request against your primary billing view. A response that needs three pages costs three cents. Requests against a custom billing view cost $0.01 per source in the view, so a view built from five sources costs $0.05 per request. There is no free monthly allowance for the API.
Is Cost Explorer hourly granularity worth enabling?
Only if you need hour-by-hour detail for the last 14 days, mainly for Savings Plans sizing or spike investigations. For most organizations it costs $5 to $100 a month. For chargeback, budgets and forecasting, the free resource-level daily data is enough, so enable hourly data only on the accounts or services where you will actually use it.
Does AWS Cost Anomaly Detection cost extra?
No. AWS Cost Anomaly Detection has no charge and uses the same billing data as Cost Explorer. What it does not do is assign the anomaly to an owner or a budget, so teams usually route its alerts into a tool or process that knows which team owns each account and tag.
Is there a cheaper way to get Cost Explorer data into dashboards?
Yes. Export the Cost and Usage Report through AWS Data Exports, store it in S3 and query it with Athena at $5 per terabyte scanned, or upload it to a cost tool. Either path removes the per-request charge entirely, keeps full line-item history beyond 14 days, and refreshes as often as AWS updates the billing data.
See where your cloud and SaaS money is leaking
Upload your cloud billing export and see your savings in dollars. Transparent pricing, no card to start.